
Debut benchmarks · Canada · 2026
Contractor Marketing Statistics 2026: What Leads, Jobs and Reviews Cost in Canada
The numbers a Canadian contractor needs to plan marketing in 2026: what a lead and a paying job cost on Google, Local Services Ads and Facebook, how fast to call back, how many reviews to aim for and what a good website does. Combined from 20+ published sources and our own data, in Canadian dollars.

- Built from
- 20+ published sources plus the Debut Trades Index
- Money
- Canadian dollars, at the Bank of Canada's 2025 average
- Report ID
- DCB-2026-v1
- Updated
- September 29, 2026
The numbers most worth knowing
- A Google Ads lead costs contractors $127 to $145. The range across LocaliQ's and SearchLight Digital's data.12 By trade it runs from $63 for pools to $319 for roofing.
- About 1 in 4.5 leads becomes a paying job. So a new customer from Google search ads costs about $660 in ad spend.2
- Local Services Ads win a customer for about $326. Half the cost of search ads, with a smaller average job.2
- A Facebook lead costs about $60. Up from $58 a year earlier, and less than half of a Google lead.3
- Calling within 5 minutes makes a lead 8 times as likely to convert. And 23% of companies never call a web lead back at all.45
- 45 Google reviews puts a BC construction company in the top quarter. The median has 28.6 68% of consumers won't use a business rated under 4 stars.7
- 53% of mobile visitors leave a page that takes more than 3 seconds. And lead pages that load in 1 second convert 3 times as well as pages that take 5.89
- 45% of consumers have used AI to find a local business. Up from 6% a year earlier.7 When Google shows an AI summary, people click about half as many links.10
Most marketing statistics are American, in US dollars, and spread across a dozen reports that each measure something slightly different. This page puts them in one place for Canadian contractors. We took the studies we trust, converted them to Canadian dollars, lined up the ones that measure the same thing, and turned them into numbers you can plan with: what a lead costs, what a paying job costs, what a budget buys.
I've run Google and Facebook ads for contractors for more than five years, and these are the figures we plan client budgets with. Every one is credited under Sources at the bottom, and you're welcome to use them: please credit Debut Marketing and link to this page.
What does a Google Ads lead cost a contractor?
The median home service lead costs about $127, and about $145 across contractors' search campaigns in early 2026.12 Leads from people who didn't search your company's name cost more, about $208. The trade matters more than anything else:
For the four trades SearchLight Digital publishes, a second study lands in the same range:
| Trade | LocaliQ median | SearchLight, new customers |
|---|---|---|
| Roofing | $319 | $173 |
| Plumbing | $180 | $256 |
| HVAC (air conditioning) | $179 | $208 |
| Electrical | $131 | $179 |
A lead isn't a job. Across 816 contractors, about 22% of Google search leads became paying customers, roughly 1 in 4.5.2 Put that together with each trade's cost per lead and you get what a new job costs in ads:
Are Local Services Ads cheaper?
Per lead and per customer, yes. A Local Services Ads lead cost about $74 across 888 contractors in February 2026, and a paying customer about $326, half the cost of search ads. The average job was smaller, because these ads lean toward service calls.2
| Measure | Local Services Ads | Search ads | Search ads, new customers only |
|---|---|---|---|
| Cost per lead | $74 | $145 | $208 |
| Leads that booked an appointment | 44 in 100 | 42 in 100 | 38 in 100 |
| Ad spend per paying customer | $326 | $660 | $1,124 |
| Average job value | $2,552 | $3,446 | $3,517 |
| Trade | Cost per lead | Leads that booked | Average job value |
|---|---|---|---|
| Electrical | $55 | 43 in 100 | $2,004 |
| HVAC | $71 | 44 in 100 | $2,949 |
| General and mixed trades | $75 | 44 in 100 | $2,559 |
| Plumbing | $80 | 45 in 100 | $2,396 |
| Drain and sewer | $82 | 40 in 100 | $2,126 |
What does a Facebook lead cost?
About $60 for a home improvement lead in 2026, up from $58 in 2025.3 That's more than the average advertiser pays, and less than half of a Google lead. Facebook leads are earlier in their decision, so they need faster follow-up.
| Measure | Home improvement | All industries |
|---|---|---|
| People who click, out of 100 who see the ad | 2.1 | 2.7 |
| Cost of each click | $3.05 | $2.52 |
| Clicks that turn into a lead, out of 100 | 5.3 | 8.5 |
| Cost per lead | $60 | $38 |
How fast should you call a lead back?
Within 5 minutes. Three studies over 14 years found the same thing, and the average company still takes far longer: in Harvard Business Review's audit, the average response took 42 hours and 23% of companies never replied.5
| Study | What they measured | What they found |
|---|---|---|
| InsideSales.com, 2021 | 5.7 million leads at 400+ companies | Leads called within 5 minutes converted 8 times as often as leads called after 6 minutes or more. |
| MIT and InsideSales.com, 2007 | 15,000+ leads and 100,000+ calls | Calling within 5 minutes instead of 30 made reaching the person 100 times as likely and qualifying the lead 21 times as likely. |
| Harvard Business Review, 2011 | 2,241 US companies | Calling within an hour made qualifying the lead nearly 7 times as likely as calling an hour later. 23% of companies never called back at all. |
How many Google reviews do you need?
In BC construction, 45 puts you in the top quarter; the median company has 28.6 The first five reviews make the biggest difference to a buyer,15 and after that the rating, how recent they are and what they say decide the call.
| Target | Metro Vancouver | Rest of BC |
|---|---|---|
| Typical company (median) | 29 | 25 |
| Top quarter | 54 | 38 |
| Top 10% | 98 | 55 |
| What to check | Good | OK | Needs work |
|---|---|---|---|
| Number of Google reviews | 45 or more (top quarter in BC) | 28 to 44 (the BC median and up) | Under 28 |
| Star rating | 4.5 or higher | 4.0 to 4.4 | Under 4.0 |
| Newest review | In the last 2 weeks | In the last 3 months | Older than 3 months |
| Your replies | Every review | Some reviews | None |
| What reviews mention | Names, the timeline and the price | One of those | Only "great job" |
What makes a contractor website work?
Speed, a clear next step and a page for every service. 53% of mobile visitors leave a page that takes longer than 3 seconds to load,8 and lead generation pages that load in 1 second convert 3 times as well as pages that take 5.9 The typical landing page turns about 7 in 100 visitors into a lead,16 close to the 7 in 100 home services clicks that call or send a form.1
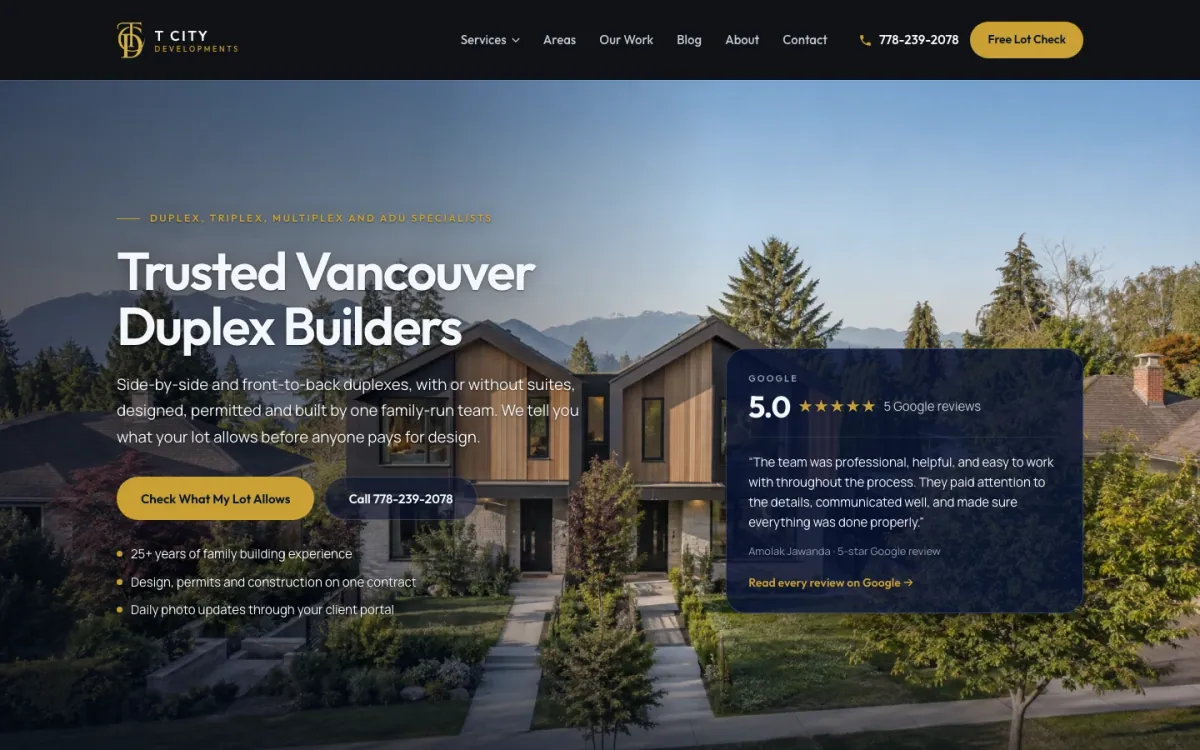
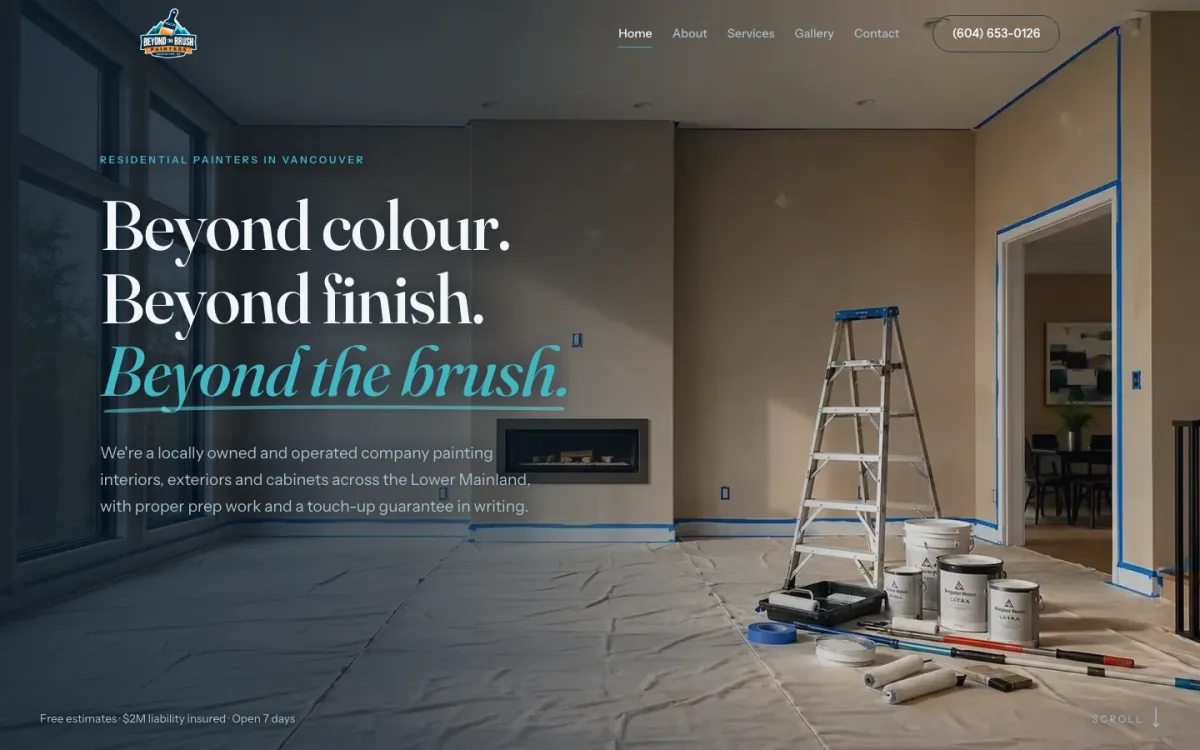
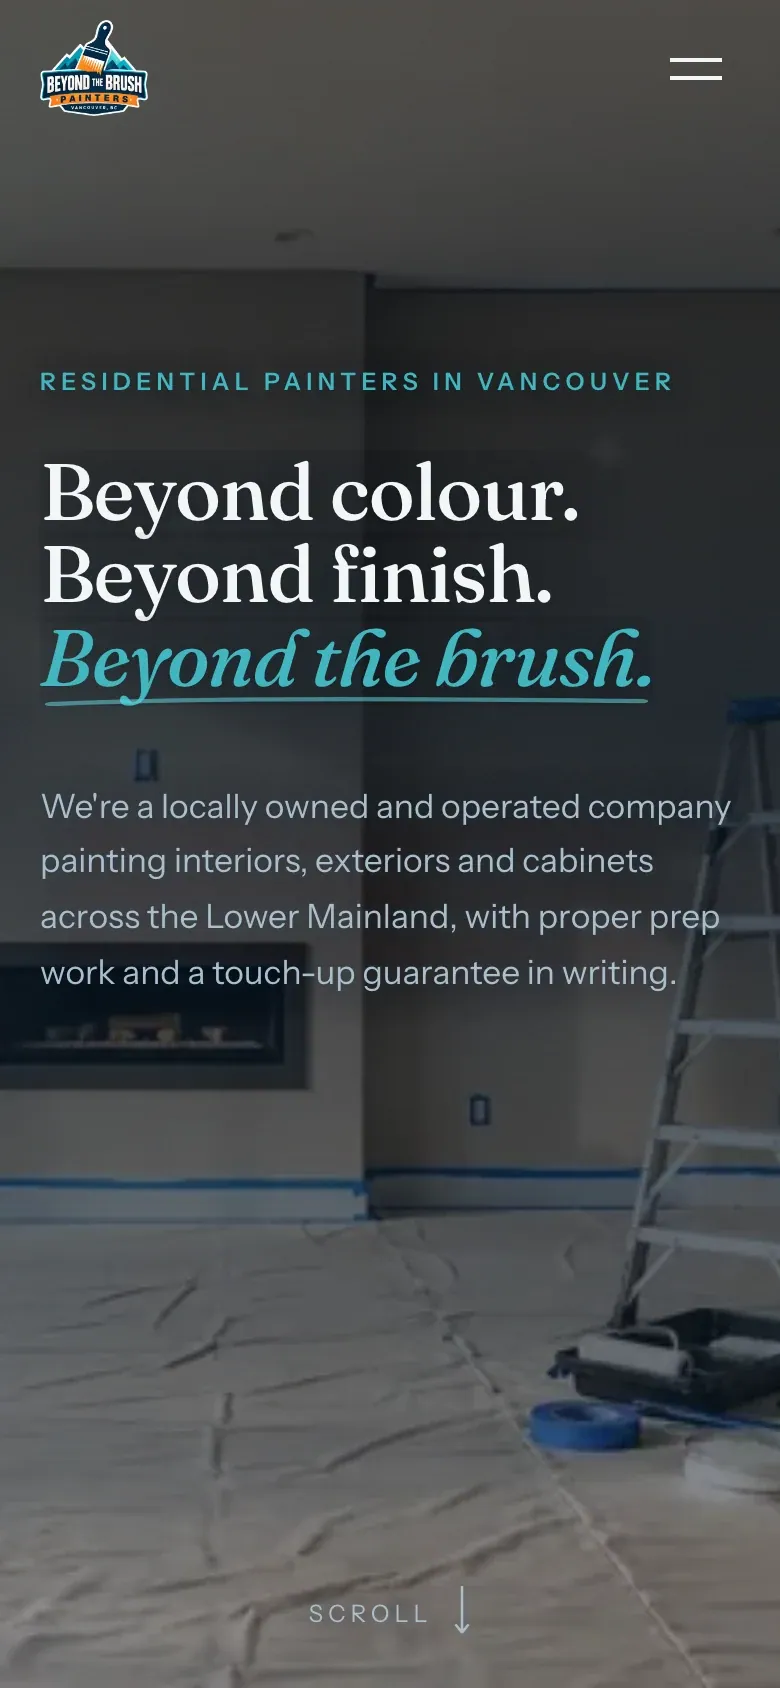
Here are five contractor websites we built, and what each one gets right. We loaded each homepage on a simulated mid-range phone over 4G on September 29, 2026.
-
T City Developments
Duplex and multiplex builder, Vancouver
- On a phone, the first screen has a call button, the 5.0 Google rating and a "Check What My Lot Allows" button
- Answers the first question every lot owner asks (what can I build?) before asking for anything
- A separate page for each build type: duplexes, triplexes, laneway homes, garden suites and more
- The main content showed in 1.4 seconds on our phone test
#97 to #4 for "Vancouver duplex builders" in 30 days of SEO.
-
Beyond The Brush Painters
Residential painter, Vancouver
- The first screen covers the usual worries: free estimates, $2M liability insurance, open 7 days and a written touch-up guarantee
- A page for each of 7 services, from interiors to popcorn ceilings
- Phone number in the menu bar on every page
- The main content showed in 0.8 seconds on our phone test
8 booked jobs from Google Ads in the 20 days after launch.
-
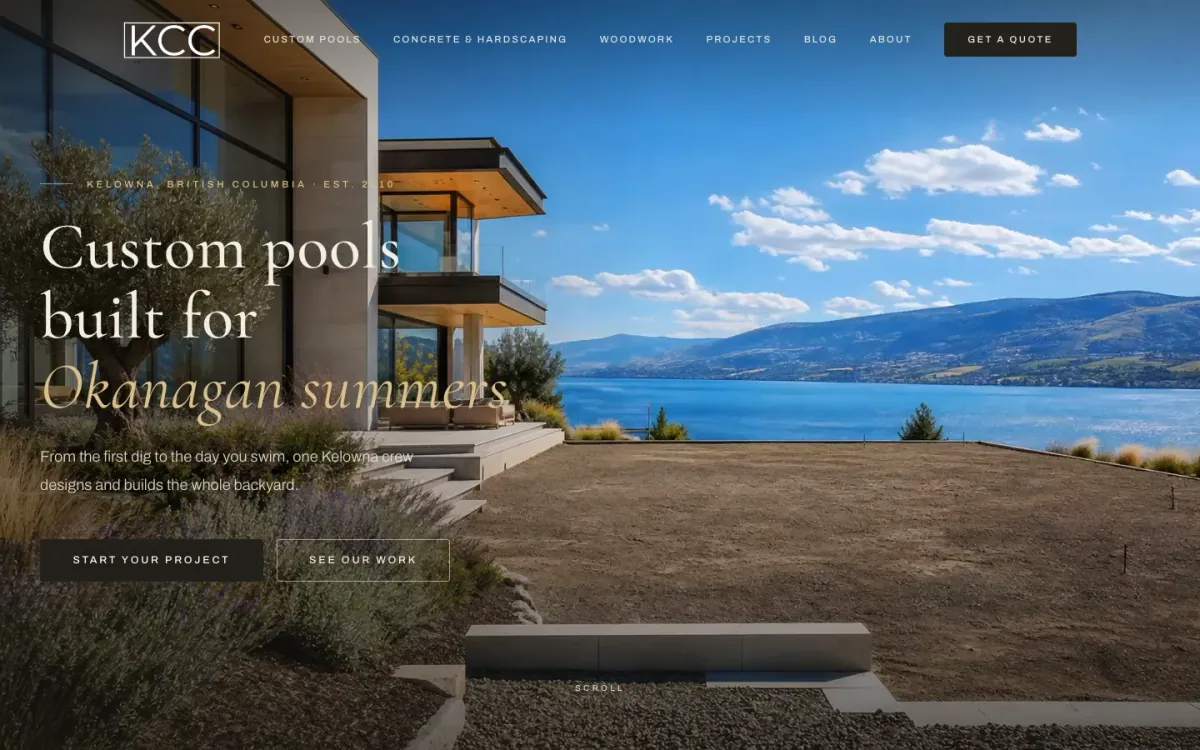
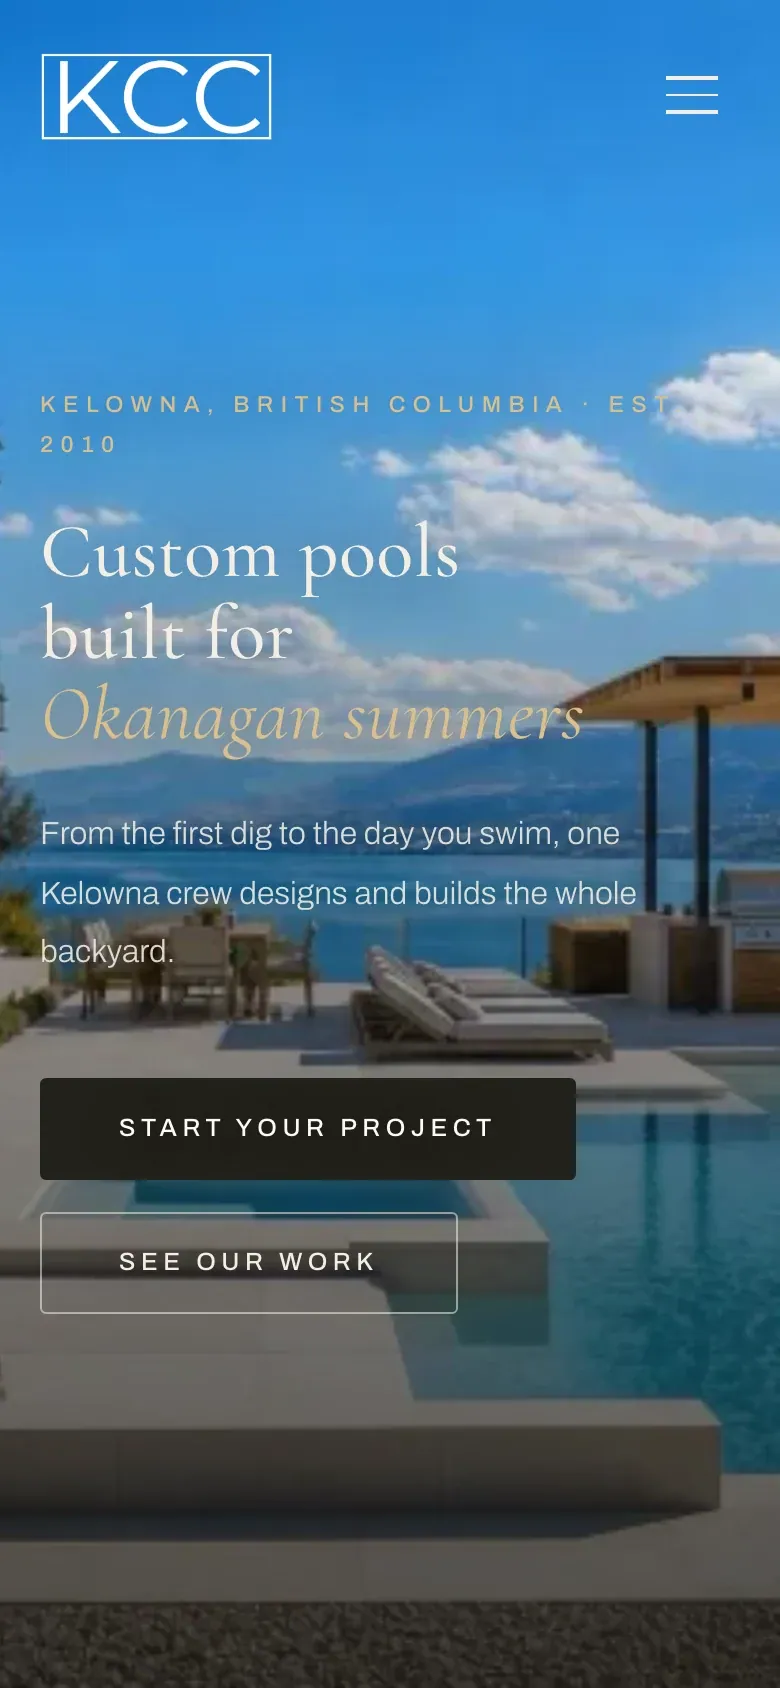
Kiwi Custom Construction
Custom pool builder, Kelowna
- "Start your project" and "See our work" on the first screen of a phone, "Get a Quote" in the menu
- A page for each service: pools, concrete and hardscaping, woodwork
- A scroll animation that builds a pool, so buyers see the process before they call
- The main content showed in 0.7 seconds on our phone test
80% more website traffic in the first three months.
-
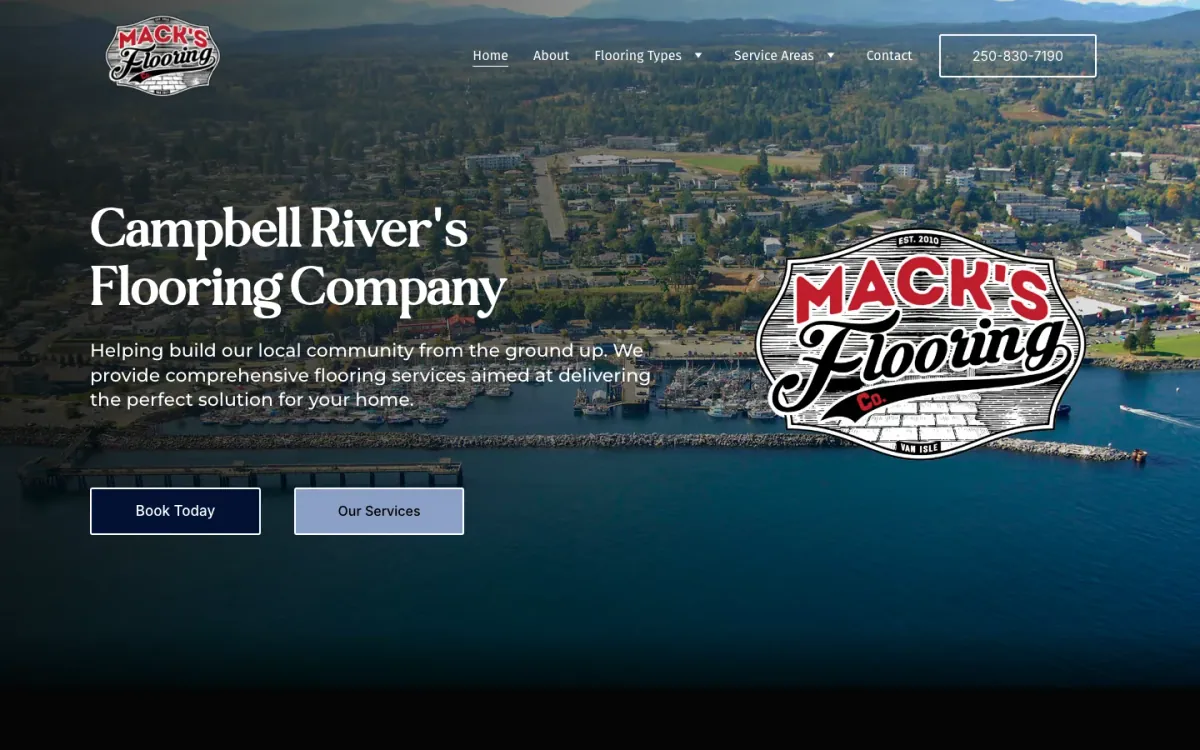
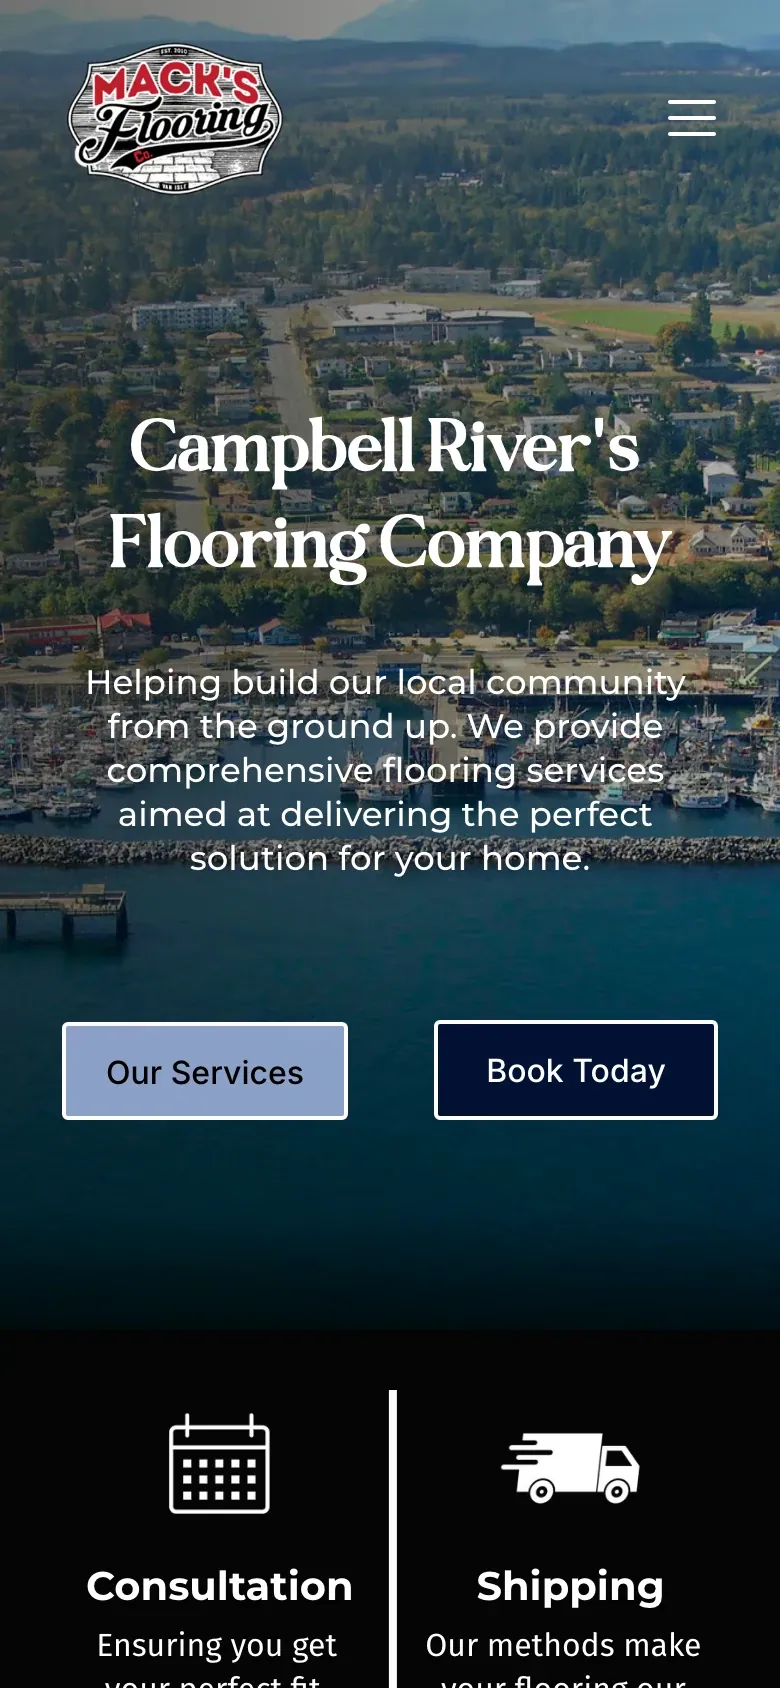
Mack’s Flooring
Flooring store and installer, Campbell River
- Phone number in the menu and a "Book Today" button on the first screen
- A page for each flooring type, plus commercial
- A page for each nearby community it serves, from Comox to Quadra Island
400+ leads and more than $1M in revenue from its marketing in the first year.
-
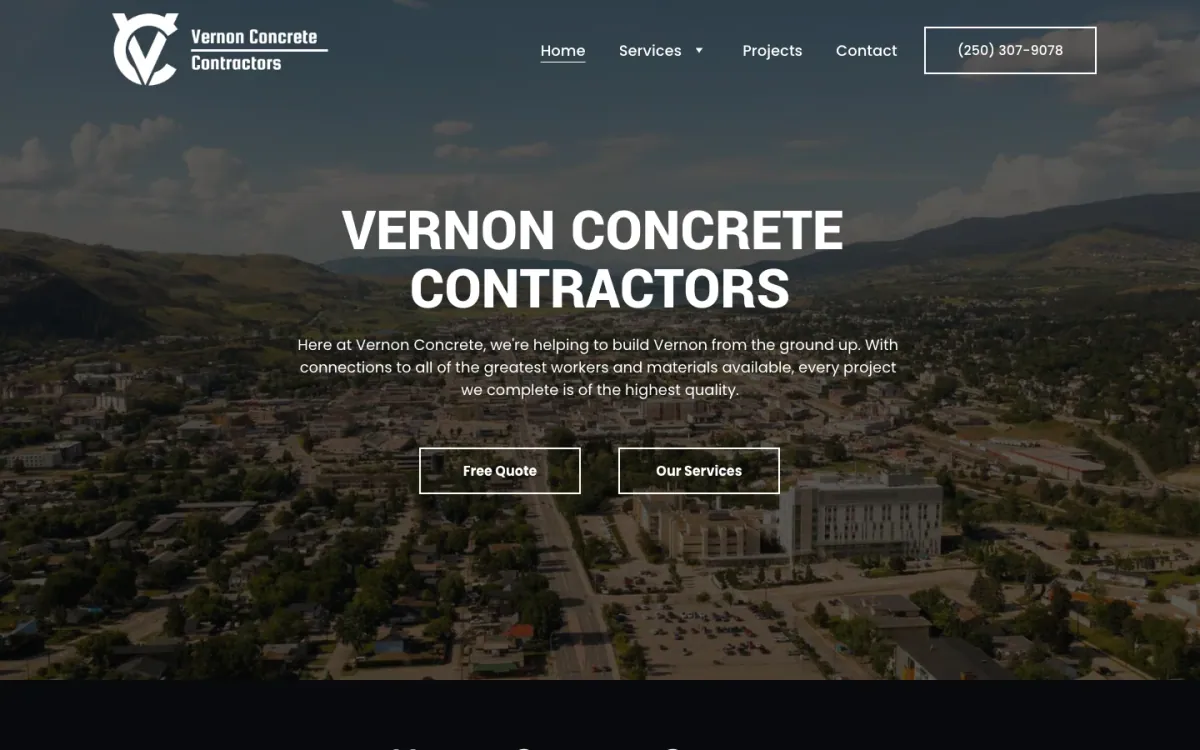
Vernon Concrete (Valley West Concrete)
Concrete contractor, Vernon
- "Free Quote" on the first screen, with the phone number in the menu on desktop
- A page for each of 11 services, from driveways to retaining walls
- Built for one town, so Google and AI tools know exactly where the company works
#1 on Google and in AI answers in Vernon, about 12 extra leads a month, no ads.


| What to check | Good | OK | Needs work |
|---|---|---|---|
| Time until the page shows | Under 2 seconds | 2 to 3 seconds | Over 3 seconds |
| Phone number on a phone screen | Tap to call, top of the screen | On the page, not tappable | Hard to find |
| Quote or estimate button | Above the fold | Lower on the page | Only on a contact page |
| A page for each service | Every service you want more of | Some services | One page for everything |
| Visitors who call or send a form | 7 in 100 or more | 5 to 6 in 100 | Under 5 in 100 |
| Photos | Your own jobs and crew | A mix | Stock photos only |
How many people use AI to find a contractor?
45% of consumers have used AI tools like ChatGPT to find a local business, up from 6% a year earlier.7 Google's AI Overviews reach more than 2.5 billion people a month,18 and ChatGPT has 900 million weekly users.19 When Google shows an AI summary, people click about half as many regular results.10
| What people did | No AI summary | AI summary shown |
|---|---|---|
| Clicked a regular search result | 15 | 8 |
| Ended their browsing session | 16 | 26 |
How much do companies spend on marketing?
Large companies spend 7.8% of revenue on marketing, up slightly from 7.7% in 2025, in Gartner's survey of 401 marketing leaders.20 Most contractors are nowhere near that size. The BC contractors we work with usually spend $1,500 to $5,000 a month all in, and healthy home service companies put 5 to 10% of revenue into marketing. What contractor marketing costs in BC breaks that down service by service.
Where are Canadian customers online?
On YouTube and Facebook. 95% of people in Canada are online, there are 33 million social media accounts, and Facebook ads can reach 24.6 million people.21
Every figure in one table
Every statistic above, with the figure we use and what it's based on. The same table is available as a CSV.
| Area | Statistic | Debut 2026 figure | Based on |
|---|---|---|---|
| Google Ads | Cost per lead, home services median | $127 | LocaliQ |
| Google Ads | Cost per lead, all contractors (every search) | $145 | SearchLight Digital |
| Google Ads | Cost per lead, new customers only | $208 | SearchLight Digital |
| Google Ads | Cost per click, home services median | $10.97 | LocaliQ |
| Google Ads | Leads per 100 clicks, home services median | 7.3 | LocaliQ |
| Google Ads | Share of leads that become paying customers | 22% (about 1 in 4.5) | SearchLight Digital |
| Google Ads | Ad spend per paying customer, all searches | $660 | SearchLight Digital |
| Google Ads | Ad spend per paying customer, new customers only | $1,124 | SearchLight Digital |
| Google Ads | Cost per lead, roofing and gutters | $319 | LocaliQ |
| Google Ads | Cost per lead, doors and windows | $280 | LocaliQ |
| Google Ads | Cost per lead, general contracting | $232 | LocaliQ |
| Google Ads | Cost per lead, painting | $193 | LocaliQ |
| Google Ads | Cost per lead, plumbing | $180 | LocaliQ |
| Google Ads | Cost per lead, air conditioning | $179 | LocaliQ |
| Google Ads | Cost per lead, landscaping | $165 | LocaliQ |
| Google Ads | Cost per lead, electrical | $131 | LocaliQ |
| Google Ads | Cost per lead, handyman | $76 | LocaliQ |
| Google Ads | Cost per lead, pools and spas | $63 | LocaliQ |
| Google Ads | Cost per lead, roofing, new customers (SearchLight) | $173 | SearchLight Digital |
| Google Ads | Cost per lead, plumbing, new customers (SearchLight) | $256 | SearchLight Digital |
| Google Ads | Cost per lead, HVAC, new customers (SearchLight) | $208 | SearchLight Digital |
| Google Ads | Cost per lead, electrical, new customers (SearchLight) | $179 | SearchLight Digital |
| Local Services Ads | Cost per lead, all contractors | $74 | SearchLight Digital |
| Local Services Ads | Ad spend per paying customer | $326 | SearchLight Digital |
| Local Services Ads | Leads that book an appointment | 44 in 100 | SearchLight Digital |
| Facebook ads | Cost per lead, home improvement (2026) | $60 | LocaliQ and WordStream |
| Facebook ads | Cost per lead, home improvement (2025) | $58 | LocaliQ and WordStream |
| Facebook ads | Cost per click, home improvement | $3.05 | LocaliQ and WordStream |
| Facebook ads | Cost per lead, all industries | $38 | LocaliQ and WordStream |
| Speed to lead | Conversion when called within 5 minutes vs later | 8 times higher | InsideSales.com |
| Speed to lead | Odds of qualifying a lead, 5 vs 30 minutes | 21 times higher | MIT and InsideSales.com |
| Speed to lead | Companies that never called a web lead back | 23% | Harvard Business Review |
| Reviews | Consumers who read reviews for local businesses | 97% | BrightLocal |
| Reviews | Won't use a business rated under 4 stars | 68% | BrightLocal |
| Reviews | Want reviews from the last three months | 74% | BrightLocal |
| Reviews | Expect the owner to reply | 89% | BrightLocal |
| Reviews | Purchase likelihood with 5 reviews vs none | 270% higher | Spiegel Research Center, Northwestern University |
| Reviews | Google reviews, median BC construction company | 28 | Debut Marketing |
| Reviews | Google reviews to reach the top quarter in BC | 45 (54 in Metro Vancouver) | Debut Marketing |
| Websites | Mobile visitors who leave a page slower than 3 seconds | 53% | |
| Websites | Conversion of a 1-second page vs a 5-second page (lead generation) | 3 times higher | Portent |
| Websites | Median landing page conversion, all industries | 6.6 in 100 visitors | Unbounce |
| AI search | Consumers who have used AI tools to find a local business | 45% (6% a year earlier) | BrightLocal |
| AI search | Searches where people clicked a result, with vs without an AI summary | 8 vs 15 in 100 | Pew Research Center |
| Budgets | Marketing budget as a share of revenue, large companies | 7.8% (7.7% in 2025) | Gartner |
| Canada | People in Canada that Facebook ads can reach | 24.6 million (61%) | DataReportal |
| Canada | People in Canada on YouTube | 33.0 million (82%) | DataReportal |
Work out your own cost per job
Pick your trade, then set your monthly ad budget, the share of leads you book and what an average job is worth. It starts from your trade's median cost per lead in Canadian dollars.
Starts from each trade's median cost per lead on Google search,1 in Canadian dollars at the Bank of Canada's 2025 average ($1 USD = $1.3978 CAD).23 About 22% of Google search leads became paying customers across 816 contractors,2 so the booking rate starts at 20%. Return on ad spend counts the value of the booked jobs, not your profit.
Where to start
Pick the number that worries you most and check your own against it: your cost per lead, how fast you call back, your review count or how your homepage loads on your phone. Fix the cheapest one first. Callback speed and reviews cost almost nothing, and they move every other number on this page.
Questions contractors ask
Where do these contractor marketing statistics come from?
From the studies listed under Sources: LocaliQ, SearchLight Digital, BrightLocal, InsideSales, Harvard Business Review, Northwestern University's Spiegel Research Center, Google, Portent, Unbounce, Pew Research Center, Gartner and DataReportal, plus our own Debut Trades Index of 99 BC construction companies. We combined them and converted US figures to Canadian dollars.
Are these figures Canadian?
The money is. Most ad studies are of US campaigns, so we converted them at the Bank of Canada's 2025 average. The review targets are from BC. In our experience, BC costs follow the same patterns, and smaller markets often cost less per click than Metro Vancouver.
Can I use these statistics in my own article or presentation?
Yes. Please credit Debut Marketing and link to this page. There's a ready-made citation under "How we put this together", a link button under every chart, and a CSV of every figure.
How often is this page updated?
When the studies behind it publish new editions, usually once or twice a year. The date at the top is the last update.
Glossary
- Cost per lead
- Ad spend divided by the calls and forms it brought in.
- Cost per paying job
- Ad spend divided by the jobs you actually won. About 4.5 times the cost per lead at the contractor average.
- New customers only
- Searches that didn't include your company's name. They cost more per lead because you're competing for them.
- Local Services Ads
- Google's pay-per-lead ads with the Google Verified badge, shown above the search ads.
- Median
- The middle value: half the campaigns did better and half did worse. It isn't pulled up by a few huge accounts the way an average is.
How we put this together
How we worked out the numbers. Every figure on this page is from the studies listed under Sources, combined by us. US figures are converted to Canadian dollars at the Bank of Canada's 2025 average ($1 USD = $1.3978 CAD).23 Cost per lead by trade is LocaliQ's median; where SearchLight Digital publishes the same trade, we show both. Cost per paying job divides the cost per lead by 22%, the share of Google search leads that became paying customers across 816 contractors in SearchLight's January 2026 data. The scorecards call a result Good when it matches or beats the benchmark and OK when it's up to 1.5 times worse.
Which studies we used. Only studies that publish their sample and date. Where two measure the same thing, we show both; where only one exists, we say so. Figures from our own work (the Debut Trades Index, client results and the website checks) are marked as ours.
Speed to lead. The studies are of US businesses across industries, not only contractors, and measure contact, qualification and conversion rather than booked jobs.
Reviews. Consumer habits are from BrightLocal's US survey; review counts and targets are from the Debut Trades Index, 99 BC construction companies on September 29, 2026.
What benchmarks can't tell you. Most of these studies are of US campaigns, and your town, your offer, your reviews and how fast you call back move every number. Use them as a starting point and judge your own results by booked jobs.
Cite this report
Striemer, E. (2026, September 29). Contractor Marketing Statistics 2026: What Leads, Jobs and Reviews Cost in Canada. Debut Marketing. Report ID DCB-2026-v1. https://debutmarketing.ca/contractor-marketing-statistics
The numbers on this page are Debut Marketing's 2026 contractor benchmarks. We combined the studies listed under Sources, converted US figures to Canadian dollars and worked out what they mean per lead and per job. You're welcome to use them: please credit Debut Marketing and link to this page.
Sources
- 1 LocaliQ (2025). 2025 Home Services Search Ad Benchmarks. 3,211 US Google search campaigns, April 2024 to March 2025. Medians, US dollars.
- 2 SearchLight Digital (2026). Google Local Service Ads Benchmarks, February 2026. 888 US contractors, $6.72 million in Local Services Ads spend and 126,650 leads. The Google search comparison is January 2026: 816 contractors, $14.9 million in spend. US dollars.
- 3 LocaliQ and WordStream (2026). Facebook Advertising Benchmarks (2026 data, with the 2025 edition for comparison). US Facebook lead campaigns: home improvement compared with all industries. US dollars.
- 4 InsideSales.com (2021). Lead Response Management 2021 (XANT). 5.7 million inbound leads and 55 million sales activities at 400+ companies, 2018 to 2020.
- 5 Harvard Business Review (2011). The Short Life of Online Sales Leads, by James Oldroyd, Kristina McElheran and David Elkington. An audit of how 2,241 US companies answered a web lead.
- 6 Debut Marketing (2026). Debut Trades Index: Digital State of BC Construction Companies 2026. 99 BC construction companies in 20 markets, scored on their Google profiles on September 29, 2026.
- 7 BrightLocal (2026). Local Consumer Review Survey 2026. 1,002 US consumers, published February 2026.
- 8 Google (2016). The Need for Mobile Speed (DoubleClick study, as reported by Marketing Dive). Mobile site visits and load times.
- 9 Portent (2022). Site Speed is (Still) Impacting Your Conversion Rate. 14 lead generation and 6 ecommerce websites: 27,000+ landing pages and 100 million+ page views.
- 10 Pew Research Center (2025). Google users are less likely to click on links when an AI summary appears in the results. Browsing data from 900 US adults: 68,879 Google searches in March 2025.
- 11 SearchLight Digital (2026). Roofing Google Ads Cost Per Lead: 2026 Benchmarks. 15 US roofing contractors, January to March 2026, $347,421 in spend and 3,304 leads, with plumbing, HVAC and electrical for comparison. US dollars.
- 12 SearchLight Digital (2026). Plumbing Google Ads Cost Per Lead. 524 US plumbing contractors, January to March 2026, $15.9 million in spend and 95,749 leads. US dollars.
- 13 SearchLight Digital (2026). What Is a Good Cost Per Lead for HVAC Google Ads?. 816 US HVAC and plumbing contractors, January 2026, $14.88 million in spend and 143,008 leads. US dollars.
- 14 MIT and InsideSales.com (2007). Lead Response Management Study, by Dr. James Oldroyd. Three years of call data from 6 companies: 15,000+ web leads and 100,000+ call attempts.
- 15 Spiegel Research Center, Northwestern University (2017). How Online Reviews Influence Sales. Purchase data compared by number of reviews and star rating.
- 16 Unbounce (2024). Average landing page conversion rates (Q4 2024 data). 41,000 landing pages, 464 million visitors and 57 million conversions.
- 17 Debut Marketing (2026). Website checks of five contractor websites we built. Homepages loaded on September 29, 2026 on a simulated mid-range phone over 4G (150 ms latency, 1.6 Mbps, 4x slower processor), plus a desktop check for click-to-call, quote buttons and service pages.
- 18 CNBC (2026). Google CEO Pichai: AI Overviews now has over 2.5 billion monthly users.
- 19 Search Engine Land (2026). OpenAI: ChatGPT now has 900 million weekly active users.
- 20 Gartner (2026). 2026 CMO Spend Survey. 401 marketing leaders in North America and Europe, mostly at companies with more than $1 billion in revenue.
- 21 DataReportal (2025). Digital 2026: Canada. Canadian internet, social media and ad audience figures for late 2025.
- 22 LocaliQ (2026). Search Advertising Benchmarks for Every Industry (2026 data). US Google Ads campaigns; home and home improvement compared with all industries. US dollars.
- 23 Bank of Canada (2026). Annual exchange rates. The 2025 average, $1 USD = $1.3978 CAD, converts every US figure on this site.
Keep reading
-
 BC Construction Companies on Google 2026: 99 Scored Our Trades Index report: the median company has 28 reviews, and commercial firms average a D. Read it
 -
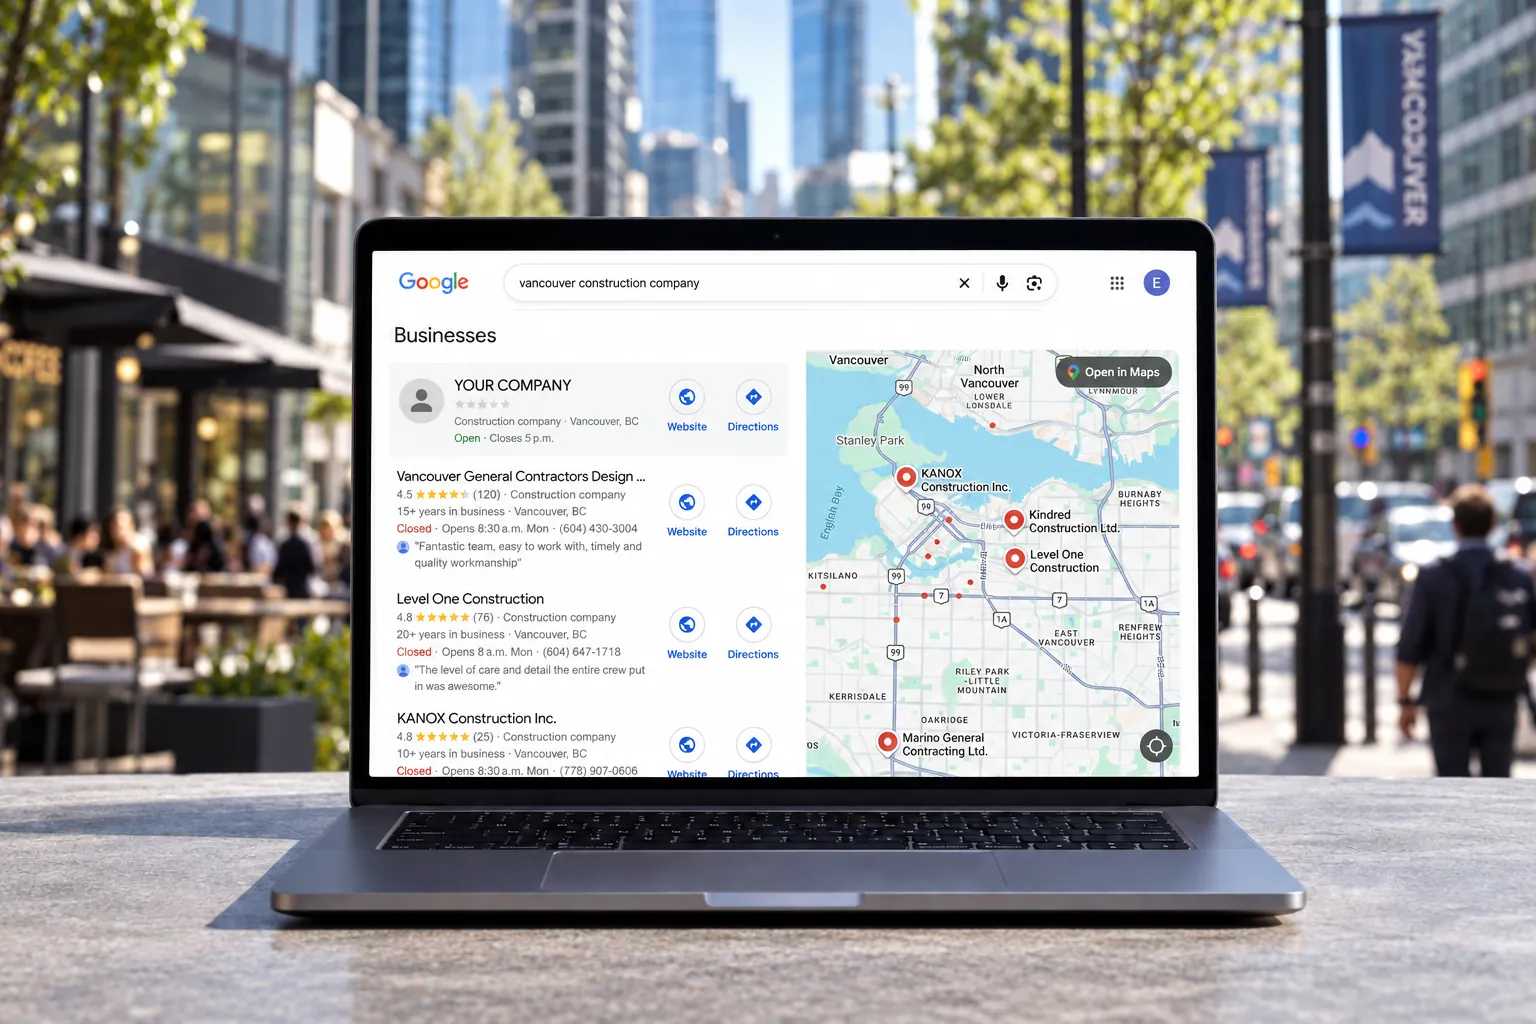 How Many Google Reviews Does a Construction Company Need? 45 reviews puts you in the top quarter in BC, and 54 in Metro Vancouver. Read it
 -
 Neighbours Are Writing Commercial Contractors' Google Reviews 34.6% of commercial listings show complaints about driving, noise or site mess. Read it